
← Project Studio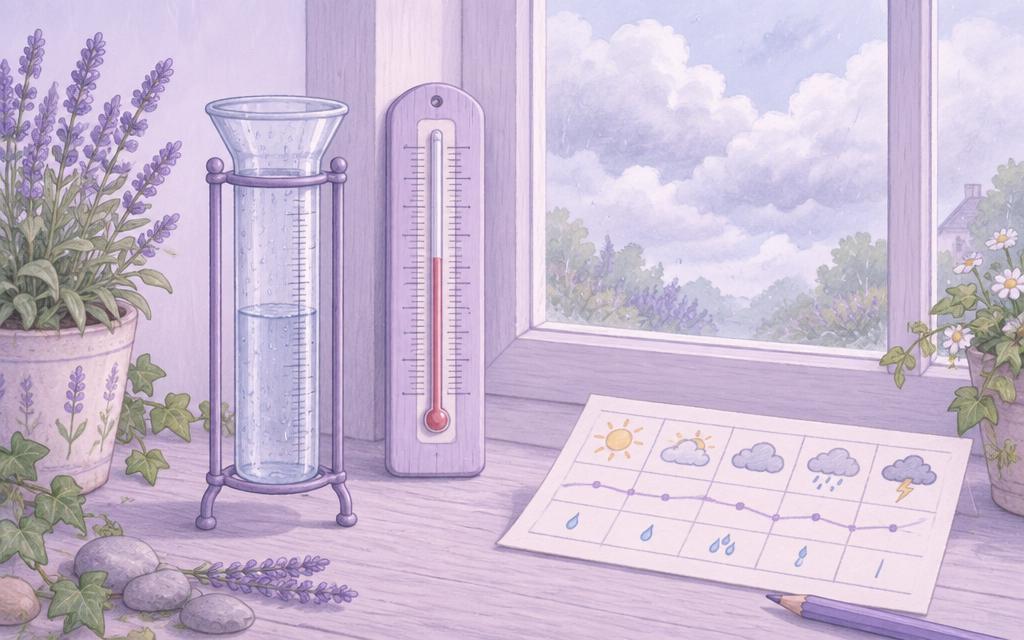
GeographyYears 7, 8About 5 sessions (estimate, no timer)
The Weather Studio
Produce a forecast supported by your own evidence — and be honest about what it can't tell you.
What you'll make
An observation log, a graph, a forecast storyboard or bulletin, and an explanation of weather versus climate.
What you'll learn
- Weather versus climate
- Reading synoptic weather maps: isobars, fronts, highs and lows
- Plotting and interpreting data
- Long-term climate change in context
You'll need
A simple thermometer, or supplied data · A rain gauge made from a straight-sided jar (optional)
Use a safe, simple instrument or the supplied data. No hazardous DIY equipment. Record whether data is your own or supplied.
Curriculum links
- Understand weather and climate, including the change in climate from the Ice Age to the present
- Use fieldwork in contrasting locations to collect, analyse and draw conclusions from geographical data
- Interpret and analyse a range of quantitative and qualitative data, including statistical data on trends and relationships between geographical phenomena
You're not signed in, so work saves on this device only.